Hello I'm Tsuneo(@yoshiokatsuneo).
Python is one of the most popular programming languages for data processing, Web service, Web scraping, or creating bots. Nowadays, Python is getting more popular for machine learning and AI because it has great libraries for it.
But, Python alone does not have the graphical features like showing tables, graphs, or figures that is essential for analyzing data.
Here comes Jupyter Notebook.
With Jupyter Notebook, you can write Python code in your browser, and view the graphs or figures in it.
Also, Jupyter Notebook enables you to write documents using Markdown. So, you can put the program and document together, and even share it with others.
Yes, Jupyter Notebook is an all-in-one package to start Python programming.
But, to use Jupyter Notebook on your PC, you need to install Python, Jupyter Notebook, or libraries and set up those. Because each PC has a different OS, version, software, or configuration, installation often fails with errors, or may break other software environment.
If you have PCs at home and at your office, you may need to install it to both PCs, and you cannot share data with those PCs.
So, here, we use PaizaCloud .
PaizaCloud is a browser-based development environment. You no longer need to install and set up the development environment. You can casually just start Web or application development right now.
PaizaCloud have pre-installed Jupyter Notebook So, you can start Python programming, anywhere, anytime. Also, major libraries like NumPy, SciPy, Pandas, or Django are also installed.
As PaizaCloud have browser-based file management, text editor, terminal, and browser(browser-in-browser), you can easily combine Python with other tools or files.
As Jupyter Notebook runs in the cloud with PaizaCloud, you can also create the note on Windows or Mac, and view it on tablet like iPad.
As both Jupyter Notebook and PaizaCloud are for casual development, those are the best combination for Python development.
Now, let's start Python programming with Jupyter Notebook and PaizaCloud!
Getting started with PaizaCloud Cloud IDE
Let's start!
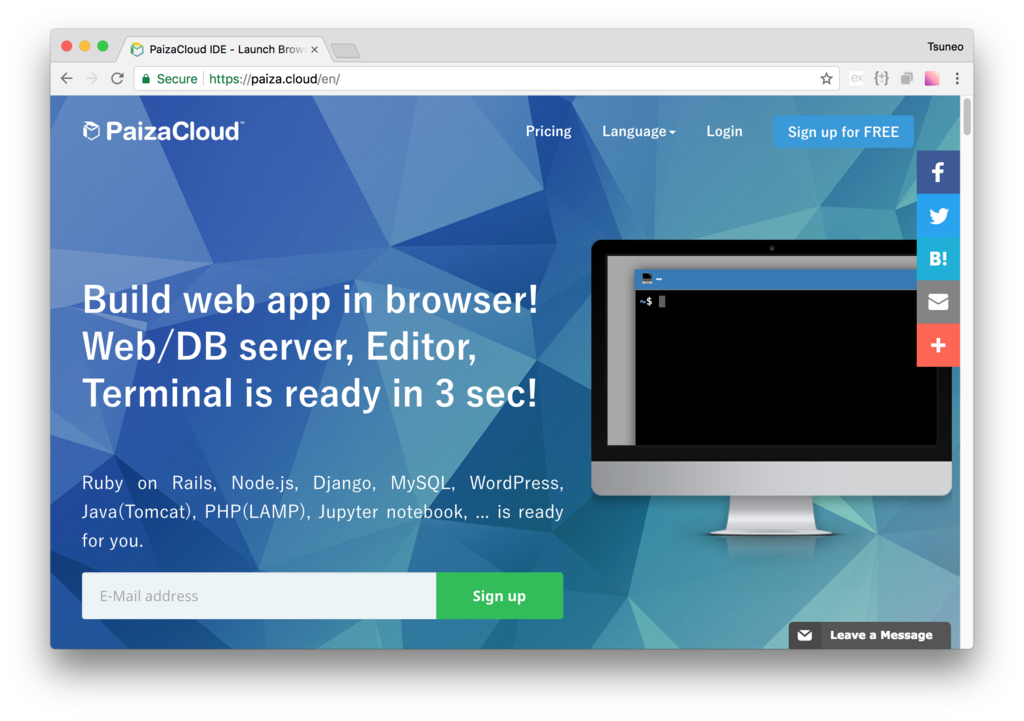
Here is the website of PaizaCloud Cloud IDE.
Just sign up with email and click a link in the confirmation email. You can also sign up with GitHub or Google.
Create new server
Next, let's create a new server for the development workspace.

Click "new server" to open a dialog to set up the server.
Here, you can choose "Jupyter Notebook", and click "New Server" button.
 Just click "New Server" button in the dialog without any settings.
s
Just click "New Server" button in the dialog without any settings.
s

Just in 3 seconds, you'll get a browser-based development environment.
Start Jupyter Notebook server
As you set "Jupyter Notebook" on the server creation, you already have Jupyter Notebook running!

You can also manually start Jupyter Notebook. Let's see.
At first, choose "Terminal" icon button and click it.

Terminal starts. Jupyter Notebook can start with a command "jupyter notebook". Type the command and push enter key.
$ jupyter notebook

The Jupyter Notebook server starts, and browser(in the browser) for the Jupyter Notebook automatically opens.
You'll also get a new button with text "8888" on the left side of the page.
Jupyter Notebook server runs on port 8888. PaizaCloud Cloud IDE detects the port number(3000), and automatically adds the button to open a browser for the port. You can also open the browser(in the browser) by clicking the button.

Using Jupyter Notebook
Jupyter Notebook manage Python program as "notebook"(The notebook has ".ipynb" file extension.)
Let's create a notebook. Click "New" button and choose "Python 3" on the menu.

The new notebook is created, and a new browser opens for the notebook.

You'll see a text box just right of a label "In [ ]: ". Here comes your Python code.
Now, let's print a string. Type "Hello " + "Paiza", and push "Run" button or Shift-Enter key to run the code.
'Hello ' + 'Paiza'
Jupyter notebook print the result string "Hello Paiza"!

Next, let's calculate.
2**10
2**100
You got the results!

Plot graph
Now, let's plot a graph. As PaizaCloud have a library "matplotlib" for plotting graph, or "NumPy" for data processing, you can just use it now.
Let's plot a sin function.
To show figures or graphs, add "%matplotlib inline" to show visuals inline. Use NumPy to create data points of sin function, and call "plot" function to plot the points.
%matplotlib inline
import matplotlib.pyplot as plt
import numpy as np

x = np.linspace(0, 10, 100)
y  = np.sin(x)
plt.plot(x, y)
You got the graph of sin function!

Let's plot a histogram. Here, we create a graph of normal distribution from random data. Create 10,000 random numbers using "randn" function, and plot them using "hist" function. "bins=100" means you have 100 boxes.
%matplotlib inline
from numpy.random import *
import matplotlib.pyplot as plt

R = randn(10000)
plt.hist(R, bins=100)
plt.show()

Now, you see a normal distribution like graph.
Try to change the number of random numbers, or the number of boxes.
Show image
You can create and show images. Use "imgshow" function to show the images.
Let's try!
%matplotlib inline
import pylab as plt
import numpy as np


Z=np.array(((1,2,3,4,5),(4,5,6,7,8),(7,8,9,10,11)))
im = plt.imshow(Z, cmap='hot')
plt.colorbar(im, orientation='horizontal')
plt.show()
(Ref :python - How can I display a np.array with pylab.imshow() - Stack Overflow)
You get a cool image!

Calculating Pi
Next, let's calculate Pi(the ratio of the circumference of a circle to its diameter) with Jupyter Notebook and PaizaCloud using Monte Carlo method. With Monte Carlo method, you'll create and put random points and calculate the number of points in the circle.
Here, create 1,000 points, and calculate the number of points in the circle. Also, make it visible by showing the points in the graph.
%matplotlib inline
import numpy as np
import matplotlib.pyplot as plt

SAMPLES=1000

xs = np.random.rand(SAMPLES)
ys = np.random.rand(SAMPLES)

inner = 0
for i in range(SAMPLES):
    x = xs[i]
    y = ys[i]
    if x**2 + y**2 < 1:
        inner += 1
print(inner *4 / SAMPLES)   # 3.1x

c1 = plt.Circle((0, 0), radius=1, fc="None", ec="r", linewidth=3)
ax = plt.gca()
ax.add_patch(c1)

plt.axis("scaled")
plt.xlim(0, 1)
plt.ylim(0, 1)

plt.scatter(xs, ys, marker="x")
plt.show()

While it is not so accurate, you got Pi value, and the figure with points for the calculation! It is more easy to understand with figures.
While we put 1,000 points here, you can try to change the number of points by changing a line "SAMPLES=1000".
Show graph from CSV file
Next, let's plot the world population.
The CSV file of the population of countries is available as CSV file, so let's use it. We can use Pandas to load the CSV file. As the Pandas is pre-installed on PaizaCloud, you can try right now.
Read the CSF file using "pandas.read_csv" function, select records where "CountryCode" is "WLD" using Pandas, and plot it using "plot" function.
%matplotlib inline
import requests
url = 'https://datahub.io/core/population/r/population.csv'
response = requests.get(url)

with open('population.csv', 'wb') as csv_file:
    csv_file.write(response.content)

import pandas
population = pandas.read_csv('population.csv', index_col=2)

plot = population[population['Country Code'] == 'WLD'].plot(title='World Population', lw=2, colormap='jet', marker='.', markersize=10)
plot.set_xlabel("Year")
plot.set_ylabel("Population")
The saved CSV file is available in the file finder(on the left side of the page). You can download or open the file. Let's double-click the CSV file to open it with text editor.
 Here, we retrieve the CSV file using Python code, but you can use other tools like "wget" to download it.
You can also save the data to file and reuse it, or process it with the other tools.
Like this, PaizaCloud allows you to use not only Jupyter Notebook alone but also Linux Server features.
Here, we retrieve the CSV file using Python code, but you can use other tools like "wget" to download it.
You can also save the data to file and reuse it, or process it with the other tools.
Like this, PaizaCloud allows you to use not only Jupyter Notebook alone but also Linux Server features.
Japanese title in the graph
In the previous example, we saw the world population. Now, let's plot the population of a specific country like Japan.
Change the "Country Code" from "WLD"(World) to "JPN"(Japan).
As PaizaCloud has Japanese fonts installed, you can use Japanese titles for the graph.
%matplotlib inline
import requests
url = 'https://datahub.io/core/population/r/population.csv'
response = requests.get(url)

with open('population.csv', 'wb') as csv_file:
    csv_file.write(response.content)

import pandas
population = pandas.read_csv('population.csv', index_col=2)

plot = population[population['Country Code'] == 'JPN'].plot(title='日本の人口', lw=2, colormap='jet', marker='.', markersize=10)
plot.set_xlabel("年")
plot.set_ylabel("人口")

Let's change the country or area, and plot the population!
Scraping
Next, let's retrieve a HTML file and parse it.
Use "request.get" to retrieve the HTML file, then parse the HTML file to get an image url from the "img" tag using "lxml", and show the images using matplotlib.
With Jupyter Notebook, you can directly show the images.
%matplotlib inline
import requests, lxml.html, io
from PIL import Image
import matplotlib.pyplot as plt

res = requests.get("http://paiza.hatenablog.com/entry/paizacloud_sinatra/2017/12/19")
root = lxml.html.fromstring(res.text).getroottree()

for imgElement in root.xpath('//img')[0:10]:
    url = imgElement.attrib['src']
    res = requests.get(imgElement.attrib['src'])
    image = Image.open(io.BytesIO(res.content))
    plt.figure(figsize = (2,2))
    plt.imshow(image)

You got the images embedded in the blog.
Try to change the URL!
Summary
We make Python programs with Jupyter Notebook and PaizaCloud.
As we can see the result as figure or graph, it is easy to change program and see what's happens.
As the PaizaCloud server runs in the cloud without installation or setting up, you can just try it in any PC or in tablet.
It is convenience for data processing, scraping or machine learning. Let's try to write the code !
With「PaizaCloud Cloud IDE」, you can flexibly and easily develop your Web application or server application, and publish it, just in your browser.